 Ramonda
Devtools
pnpm add -D @ramonda/devtools
// main.ts — anywhere before your app mounts
if (import.meta.env.DEV) await import("@ramonda/devtools");
The import registers a <ramonda-devtools> element and nothing else. A purple R appears in the
bottom-right corner; click it, or press Alt+D, to open the panel.
That line is yours to write, and it cannot move into the framework. Core does attempt the import itself in a development build, with the specifier as a variable — and it has to be a variable, because a literal one breaks apps that do not use devtools at all:
a literal import("@ramonda/devtools") inside core | |
|---|---|
vite build | fails — Rollup failed to resolve import "@ramonda/devtools" |
| esbuild | bundles, and ships a bare specifier no browser can resolve |
A variable specifier is left alone by the bundler, which means the browser has to resolve
@ramonda/devtools on its own — and it cannot. So only your app can load the panel: it is the one that
knows the package is installed, and its bundler is the one that can resolve it. If you have never seen
the badge, that missing line is why.
Finding a component
Three ways, and the third is usually the fastest.
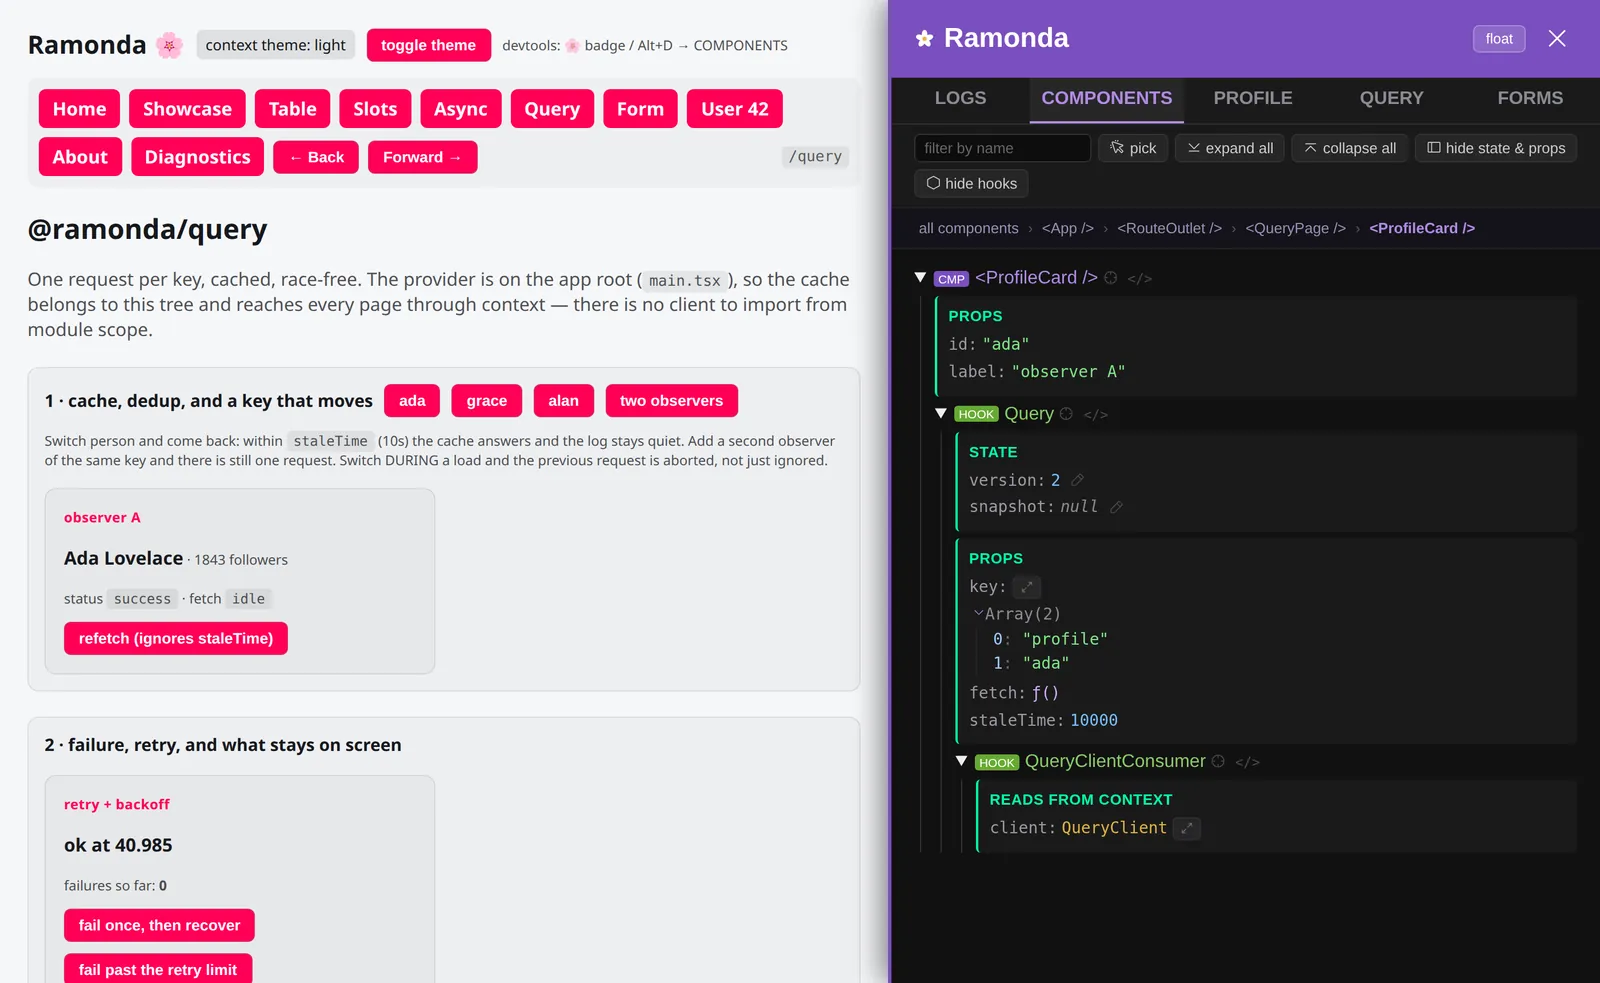
Scroll the tree. The COMPONENTS tab is your app: components in purple, hooks in green, each
with its state, props and nested hooks. The toolbar and breadcrumb stay pinned to the top while the
tree scrolls under them.
Filter by name. Type in the toolbar's search box. Branches with no match disappear, and the ancestors of a match stay — so the result still reads as a tree and you can see where the thing you searched for lives. State and props are hidden while filtering, because they are what you scroll past while looking. Typing also opens collapsed branches, so a hit is never hidden inside one.
Every button says what it is. The panel's buttons are drawn rather than lettered, and each one carries the name used here — hover to read it. They are drawings and not characters because a character is drawn by whatever font the machine has, which made the same toolbar look different on every one of them.
Point at it on the page. This is the reverse of the other two, and it matches how you actually think about a UI: you know what on screen you care about, not where it sits in the tree.
- Click pick in the toolbar. The cursor becomes a crosshair.
- Move over your app. The component under the cursor is outlined, and its name appears next to the
cursor — a
<strong>inside a row names the component that owns it, not the element. - Click. The picker turns off and that component becomes the focus of the panel.
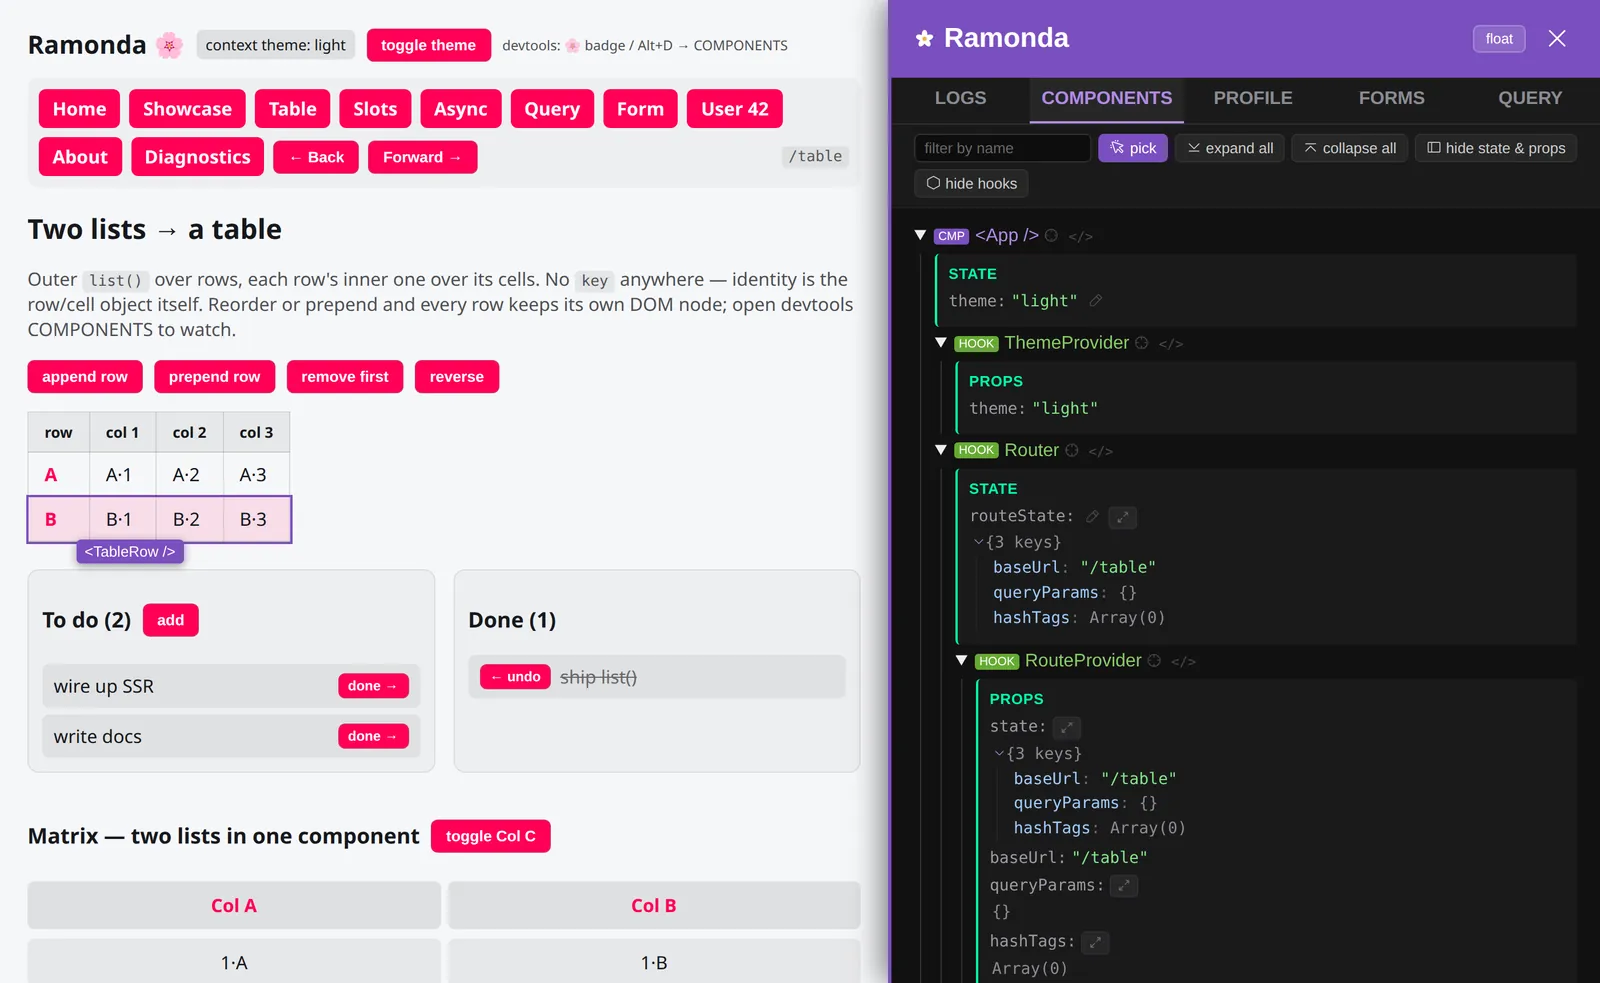
While picking, the app does not see your clicks: a pick that also submitted the form it was aimed at
would be useless. Esc cancels, and closing the panel or leaving the tab stops it, so the
page is never left with a crosshair.
Working on one component
Clicking focus this component on any row focuses it: that component becomes the root of the panel, so its state, props, hooks and children are all that is left on screen. Above it, a breadcrumb says where it sits:
all components › <App /> › <ProductsPage /> › <ProductDetail />
Every crumb is itself a focus target, so the view widens one step at a time. all components — or
Esc — releases it.
</> opens the component in your editor. The panel asks your dev server to launch it — Vite
serves a /__open-in-editor endpoint, so whatever editor is actually open is the one that opens,
with no protocol handler to register and nothing to configure. On a server without that endpoint the
location goes to your clipboard instead, and the log says so.
Where the location comes from is worth knowing, because it is the reason this needs nothing from you. The framework reads it off the stack the first time a component is constructed — no build plugin, no JSX transform, and it works for a class with no decorators at all.
A stack reports positions in the file the engine loaded, and Error.stack is never sourcemapped
(a browser applies sourcemaps when it displays a stack, never in the string). That is not a small
gap: a class declared on line 20 of your file appears on line 51 of the module Vite serves, because
decorators are lowered and a preamble is prepended. So the panel resolves the position through the
module's own inline sourcemap before asking the editor to open anything — including the file name,
which is what keeps a bundled development build from opening the bundle.
Focus is what makes the panel usable while an app is running. The tree is re-read continuously, and without focus you are reading a list that grows and shrinks under you. If the focused component unmounts, the breadcrumb says so and the whole tree comes back, rather than leaving you with an empty panel and no way out.
Hovering any row highlights the real element on the page — by direct reference, not by matching names, so it is exactly the element that component owns.
Reading a value
Every value — state, a component's props, a hook's props, a query's data — renders as a collapsible
tree: keys and types coloured, containers labelled by size (pages: Array(8)), everything past the
first level collapsed until you open it. What you scan is the shape, not the first two thousand
characters of it.
The full view button on a row opens that one value on the whole panel, where it can be scrolled, switched to pretty-printed JSON with raw, and copied with copy.
The full view is a snapshot, deliberately: a tree that moved while you were four levels into it could not be read. When the app writes a different value, refresh lights up and pulses — click it to see the new one. Nothing repaints until you ask. If the value is gone entirely, the button says so and keeps the last snapshot.
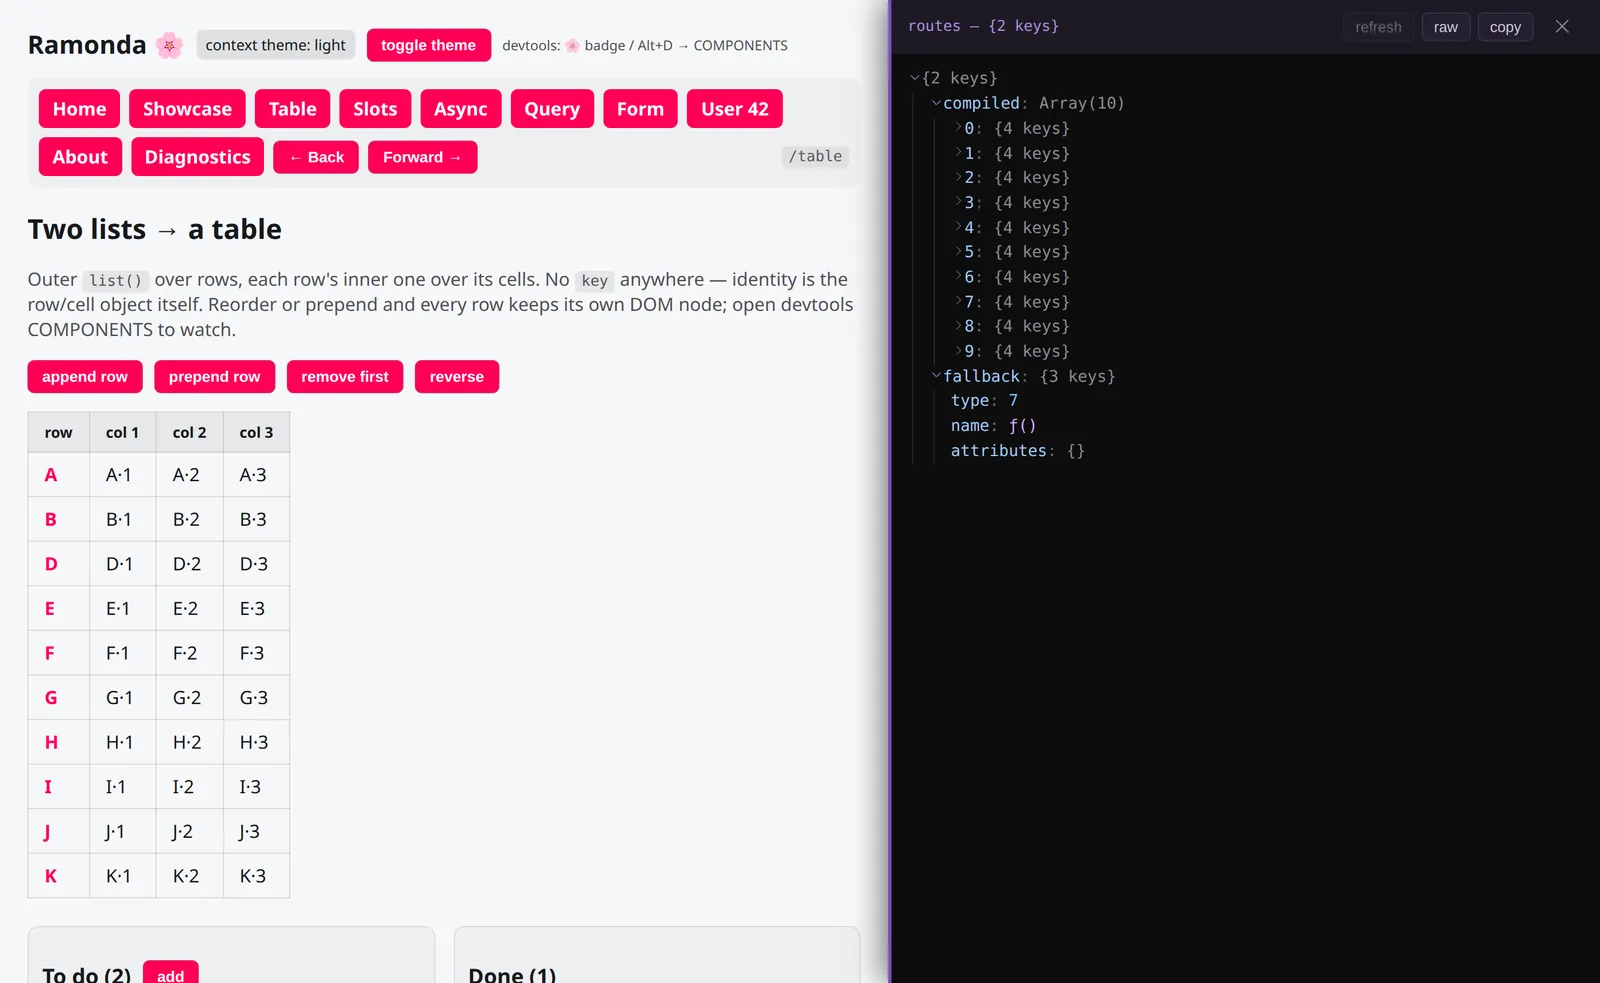
A value tree is bounded twice: a node budget and a depth cap, with cycles named as [circular].
Whatever is dropped says so in the row where it was dropped, so a large value is never quietly
truncated into something that looks complete.
Changing a value
The edit button on a state row opens the value as JSON, in place. Enter applies it, Esc abandons it,
and a multi-line value takes ⌘/Ctrl+Enter so plain Enter can still be
a newline. Invalid JSON never reaches your app: the parse happens first and the row tells you what was
wrong.
Two things about it are the framework's rules rather than the panel's:
You edit the whole field. A signal holds a value, not a proxy — mutating inside an object
notifies nobody — so "change user.name" has to become "assign a new user". The panel is held to
the same rule as your code.
Props have no pencil. They are owned by whoever rendered the component, and assigning to one throws in every build. A box that pretended otherwise would either throw in your face or look like it had worked until the next render put the old value back. The same goes for a hook's props, which come from its owner's callback.
A write goes through the ordinary setter, so everything downstream is ordinary: the signal notifies,
the component rebuilds, @updated runs, and a diagnostic fires if the value is not serializable.
Some fields are owned by the machinery around them, and the panel will tell you when you have met
one. A query hook's version is an invalidation counter and its snapshot is the hydration transport
— write either and it lands, is honoured, and is immediately set again by the hook, because what the
page renders comes from the cache. The panel says wrote version = 99, and then
version was written, and the app has since set it to 3. That is the difference between a control that
looks broken and one that explains the framework.
What a context consumer shows
A consumer has no state and no props — its values are accessors over the provider's signals — so it reports something of its own instead: Reads from context, listing the keys it is subscribed to with their values, and naming the keys it has never read.
That second part is worth reading carefully, because it is the fine-grained subscription made
visible. A consumer that only ever read theme.color is not woken by a change to theme.width, and
this is where you can see which of the two you have.
The panel deliberately does not read a key the consumer has not read, because reading is subscribing: doing so would widen what the owning component re-renders on. Inspecting never changes behaviour.
What an instance holds
Some hooks keep their state in plain fields behind a @state counter, so their state reads
{ version: 7 } and their props never change. Those two rows are all a tree of state and props can
say about such a hook, and they say nothing.
That shape is what the framework recommends rather than an oversight. @state means "serialise me
into the hydration blob", so a hook holding a Date, a File or a class instance — a form's values,
a mutation's result — keeps them in ordinary fields and bumps a counter to schedule the render.
Such a hook can answer for itself, and @ramonda/form and Mutation both do. The panel shows it
under Holds:
Holds
  values      { email: "a@b", password: "" }
  errors      { password: ["at least 8 characters"] }
  touched     ["email"]
  isValid     false
To do the same in your own hook or component, define the method:
import { INSPECT } from "@ramonda/core";

class Basket extends Hook {
  @state private version = 0;
  private lines: Line[] = [];

  @compute private get total(): number {
    return this.lines.length;
  }

  [INSPECT]() {
    return { lines: this.lines, total: this.total };
  }
}
It is read-only in the panel — this is what the instance derived, and writing to a copy of it would change nothing while looking as though it had. It is called on the instances the tree walk already visits, so one that unmounts stops contributing with nothing to deregister. If it throws, that row shows the error and the rest of the scan carries on.
Make it a pure read
The panel calls it on every commit while it is open on this tab — the same cadence as reading
@state, not a timer. So writing state from inside it closes a circle: the write schedules a render,
the render commits, the commit pings the panel, and the panel asks again.
Nothing catches that today, and it turns only while somebody is looking, which is the worst time for an app to start changing under them. Read fields, derive values, return. No writes, no fetches, no logging.
The query cache
The QUERY tab lists every live cache, with each entry's key, status, freshness, observer count and
data. 0 observers · waiting for gc is the interesting state: the entry is alive but nothing is
watching it, so it is sitting out its gcTime.
Two actions per entry:
- invalidate — marks it stale and asks whoever is watching to refresh.
- remove — throws the data away. A query still being watched will fetch again from nothing.
The edit button on a row edits the cached data, and this is the one edit in the panel whose effect you see on
the page immediately — because the cache is what a query renders from. It goes through the same
setData an optimistic update calls, so a fetch in flight is abandoned (it is older information than
your write), structural sharing keeps the identity of everything that did not change, and every
observer is notified. A refetch will replace it, which the panel says when it writes.
No pencil appears when the copy the panel holds was bounded — a large value arrives with markers where the rest was dropped, and writing that back would put the markers into your cache.
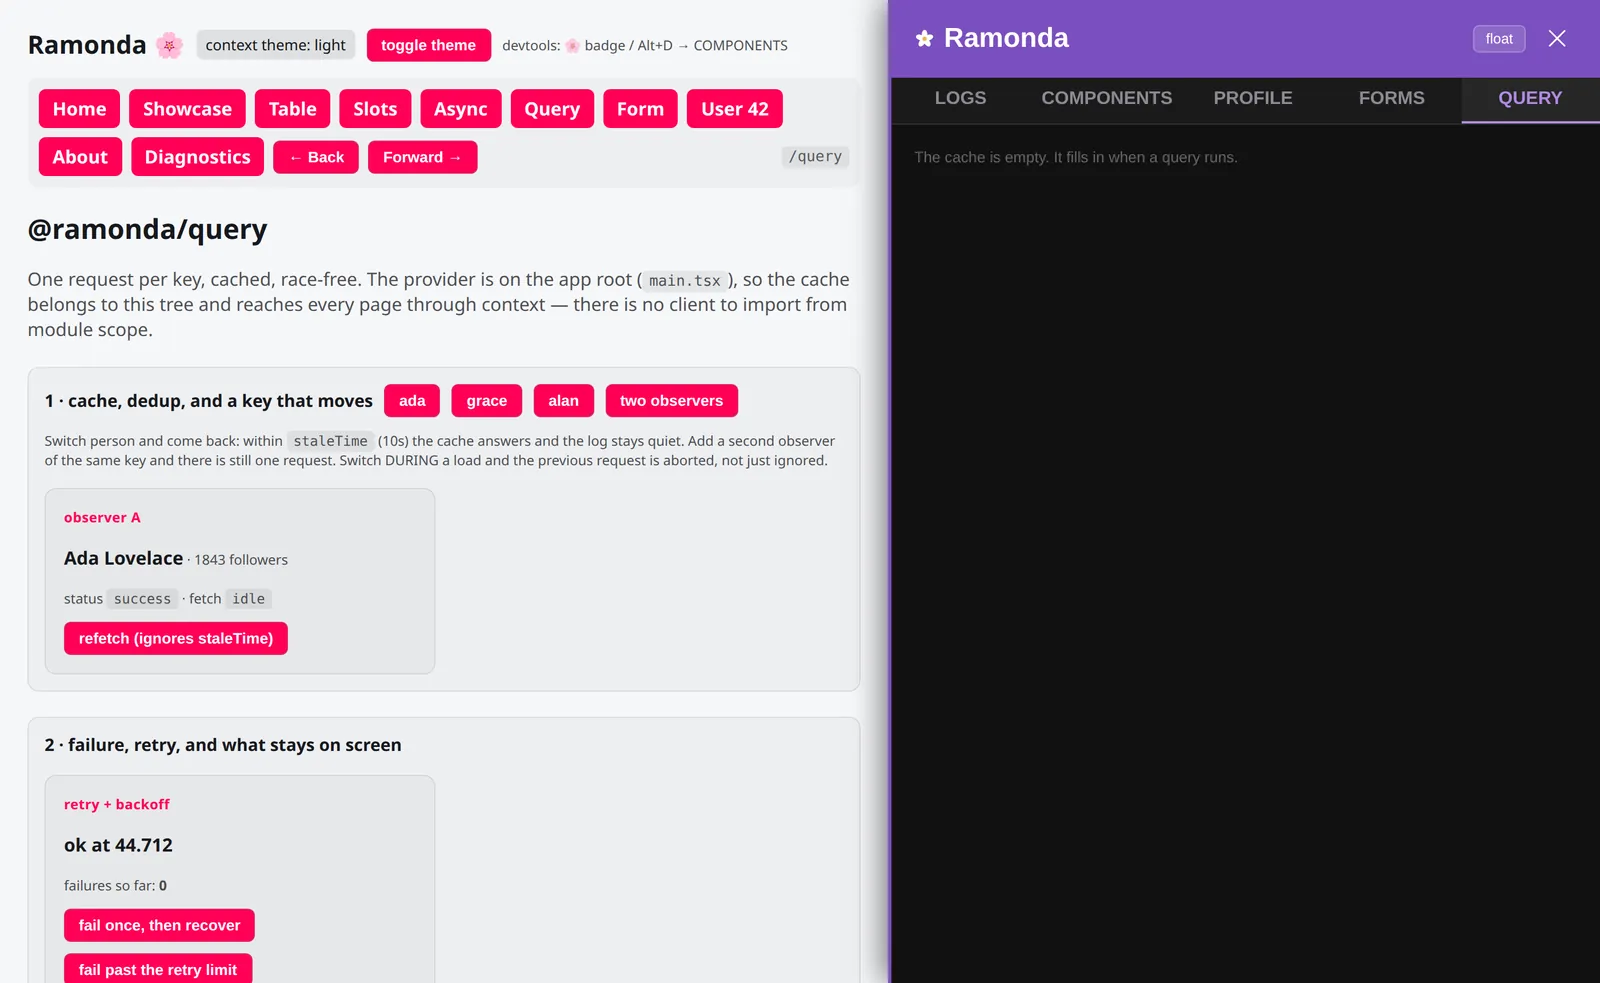
There is no refetch button, and that is the design rather than an omission: the fetcher belongs to
the observer, not to the cache, so an entry nobody is watching has no function to call. invalidate
is the honest equivalent.
Forms
The FORMS tab lists every mounted form: whether it is valid, how many fields have been blurred and
how many edited, and whether it has been submitted. A valid form is one line.
An invalid one gets a row per field that is actually wrong, with the message and whether that
field has been interacted with at all. That last part answers the question forms actually raise —
it says this is required and I have not touched it — which is usually validateOn: "submit" doing
its job.
Two actions, and both go through the form rather than around it:
- reset — back to the defaults, revalidated.
- submit — the real submit, validation and
onSubmitincluded. The panel asks the app to do what the button does; it does not simulate it.
The values are read-only here, and the reason is the schema: a form holds the schema's input side,
which is where a Date or a File lives, and those do not survive being typed back as JSON. reset
is the honest write.
Naming a form
With two forms on a page the tab groups each one's rows under its name, so a broken field sits visibly
inside the form it belongs to. Unnamed, that name is Form 1, Form 2 — the order they mounted in,
which is rarely what you wanted to know. Name it in the third argument to use():
private signup = this.use(Form<typeof schema>, () => ({ schema, defaultValues, onSubmit }), { label: "Sign Up" });
The tab and the component tree then call it Form (Sign Up) — the class says what it is, the label
says which one, and neither answers for the other.
That third argument is metadata about the hook, and it is separate from the props for a reason: a
hook's props belong to whoever wrote the hook. A framework that reserved label in there would collide
with a real one eventually, and on a form it collides at once, because a form is full of labels. The
hook never sees this argument. It works for any hook, costs nothing in production, and is read only by
the tools looking at your app.
What a commit cost
The PROFILE tab is off until you press record, and that is the design rather than a limitation: a
commit is the hottest path in the framework, and sampling it unconditionally would tax every
development build. While recording it costs about 3.6% of a commit (measured over 200 commits of a
51-component tree, alternating recorded and unrecorded runs); while stopped it costs one boolean test.
Each row is one commit, which here means one drain — everything a single state change rebuilt,
including the subscriptions and @updated bodies it scheduled, because that is what the app waited
for. Timing individual builds and adding them up would leave out the diff, the DOM and the post-commit
flush, which is the part that hurts.
Under each commit, the components that made it up with their share of it:
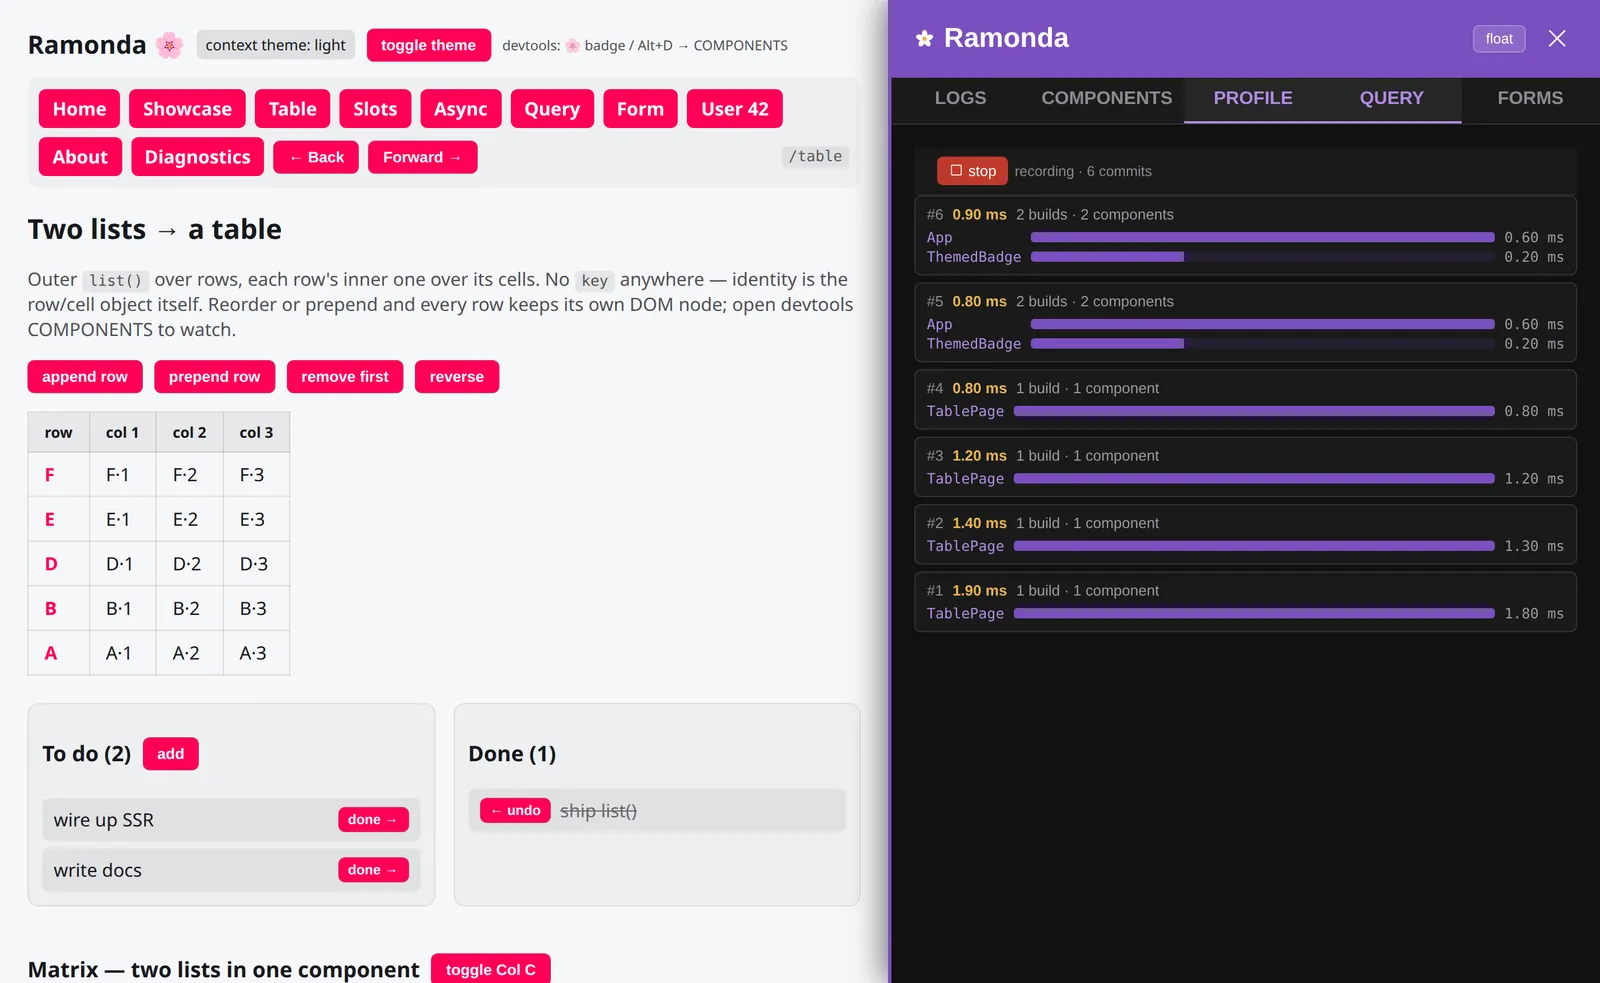
The count is usually the more interesting number than the milliseconds. Read that capture: appending
a row to a table of ten rebuilt one component — the page — because list() keeps each row's scope
and its DOM node, so the rows were never asked to render. Then toggling the theme rebuilt two: the
component that provides the context, and the one badge that consumes it.
That is the shape you are looking for. A commit that says Row ×40 after one row changed is not a slow
component; it is forty renders that did not need to happen, and it is usually a key, a @compute or a
@StableProps away from being one. Performance is which of the three, and why.
Docked or floating
Opening the panel docks it: the app reflows into the space beside it, so nothing is hidden behind the panel and a highlight is always visible. Drag its left edge to resize; the width is remembered.
The header's dock/float button switches to an overlay instead, for a layout that does not
take being narrowed. What docking cannot squeeze is an element your app positions fixed, or a
layout pinned to 100vw — browser devtools has the same limit, and floating is the answer when it
bites.
One case chooses for you. When the framework opens the panel itself, it floats, and says why under the header: docking would reflow your app, which can flip a media query — and then the layout you are looking at is not the one the problem happened in.
When something goes wrong
A dev error does not open the panel. The badge detonates instead — a burst, then a red badge with a count that stays until you look.
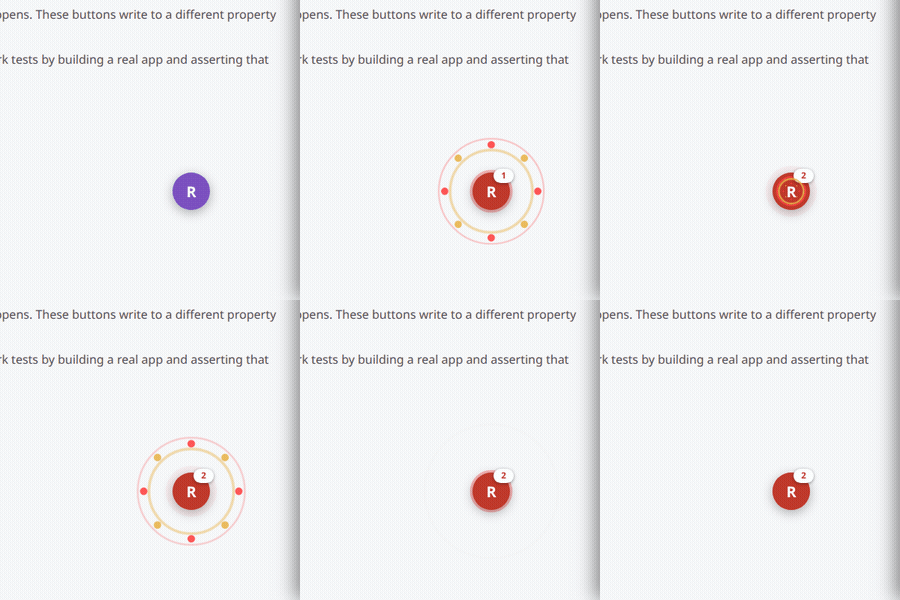 Nothing about your app moves, and what you were doing is exactly
where you left it. Open the panel when you are ready; the
Nothing about your app moves, and what you were doing is exactly
where you left it. Open the panel when you are ready; the LOGS tab has the error, with its data
logged to the console when you click it.
Diagnostics land there too — RMD* from the core, RMQ* from the query cache, RMF* from forms,
RML* from immutable updates. Each one is explained in the
diagnostics reference, and the row's data carries its fix and the values
the message named.
Collecting them yourself
Every diagnostic is a record, and this panel is only one consumer of it. To take them somewhere else — a test, a log shipper, your own overlay — subscribe:
import { installDiagnostics } from "@ramonda/devtools";

const stop = installDiagnostics((record) => {
  if (record.severity === "error") myCollector.alert(record);
});
Core's rows reach this tab through its own log channel rather than through the sink, so subscribing gets them once and the tab shows them once.
Subscribe rather than assigning globalThis.__RAMONDA_DIAGNOSTICS__ yourself: the sink is one
function, so an assignment replaces whoever was there — usually this panel, which then quietly stops
filling. Several subscribers share one sink, and the returned function removes yours (call it from
import.meta.hot?.dispose in a module that hot-reloads). The panel says so in the console if it finds
the sink taken.
What is remembered
Two kinds of thing, kept in two places:
- Preferences — width, docked or floating, and the two toolbar filters. Stored per origin, so they are the same tomorrow.
- Your debugging session — whether the panel is open, which tab, what you were filtering for and the component you had focused. Stored per tab, so a reload in the middle of a session picks up where you were, and a new tab starts clean.
Nothing goes into the URL, so a link you share carries none of it.
Shortcuts
Alt+D | open or close the panel |
Esc | close the full value view, then release the focused component |
| focus this component, on a row | make it the panel's root |
</> on a row | open its definition in your editor |
| Drag the left edge | resize |
| Drag the badge | move it out of the way |
A tab of your own
QUERY and FORMS are not built into the panel — each package describes its own tab and registers
it. Anything with state worth looking at can do the same, and it takes about fifteen lines. See
Adding a tab.
In production
Nothing here ships. The panel is a separate package you import behind a development-only condition,
and the framework's own inspection hooks are inside if (__DEV__) blocks that your bundler removes.
Next
- Adding a tab — a panel of your own, if your package has state worth seeing.
- Diagnostics — what the framework reports into the Logs tab, and what each code means.